...this likely means my defensive analysis, while often accurate, is suffering from teamwide biases far FAR larger than I ever imagined. For example...I'll bet you a plug nickel that the mid-90s Braves were on the bottom left side of that chart in team-wide batted ball speed at least partially explaining their phenomenal team defensive record. Same may be true for the 2000s Cardinals.
Hoo boy...then the question is...given that we will never have this data going further back than 2009...how the heck can I make a proper reckoning of historical performance that somehow tries to include this facter? How can I tell if a team's pitchers bias toward slow batted ball velo? Maybe there will be a correlation between K rate, K/BB and batted ball speed that is sufficient enough to use DIPS statistics to pick out the likely DIPS overachievers and underachievers??
*headache*
 ..................
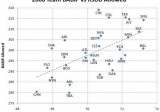
Q. How much difference in batted-ball MPH is there between pitchers? 0.2, 0.4 MPH?
A. BP only had data for 2009. CC Sabathia gave up batted balls that averaged 68 MPH; Silva gave up batted balls averaging 75 MPH.
Here's the chart via direct .jpg, if the one in this window doesn't include the bottom axis.
Notice that Miguel Batista, Carlos Silva, and Ian Snell are poster boys for crushed balls-in-play. Tampa Bay has been using MPH for pitchers since at least 2009. The Mariners apparently weren't using it when they stubbornly ran Ian Snell out there for 20 more starts than he should have gotten.
You might remember SSI whining, about 2007-09, that the Mariners' fielders were suffering precisely because of blizzards of hot-shot grounders and line drives off M's pitching. Dr. D would consider this now factually established.
.
Q. Why did the ca. 2008 Mariners have so many of these extreme crush-ball pitchers?
A. Dr. D would worry that perhaps other GM's, who were intuiting Batista's, Silva's, and Snell's problems, were letting these pitchers fall to the M's.
Very possibly, Bill Bavasi was using pure sabermetrics to choose these kinds of pitchers, and sabermetrics was saying that BABIP is pure luck. Meanwhile, the Pat Gillicks and Walt Jockettys of the game were looking at guys like Miguel Batista and saying, "You know what, I think I'll step aside for you on this one."
Whether that was the case for Batista and Silva or not, Dr. D is quite sure that this occurs a lot in baseball. Field-level intuition captures a lot of things that simple mathematics cannot.
Lucky for us, Jack Zduriencik has this intuition. We're the Big Dogs now, from that standpoint.
.
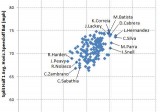
Q. Do pitchers control BIP speed to any important extent?
A. To give you a feel for how impactful this discovery is, consider he money chart of the entire two-part series, this chart 'rat cheer.
Notice that, teamwide, there were large differences in the batted-ball MPH allowed by entire pitching staffs. The 2009 Mariners gave up 71.5 MPH on their batted balls; the Red Sox allowed only 69.5 MPH. Remember, that is an average that reflects an entire season's worth of batted balls.
.